

Forestate
Showing in real time how forests reappear and
disappear across our planet.
Satellites monitor how much forest is disappearing and reappearing at every moment of the day. It’s unimaginable. To help change this, we created Forestate.

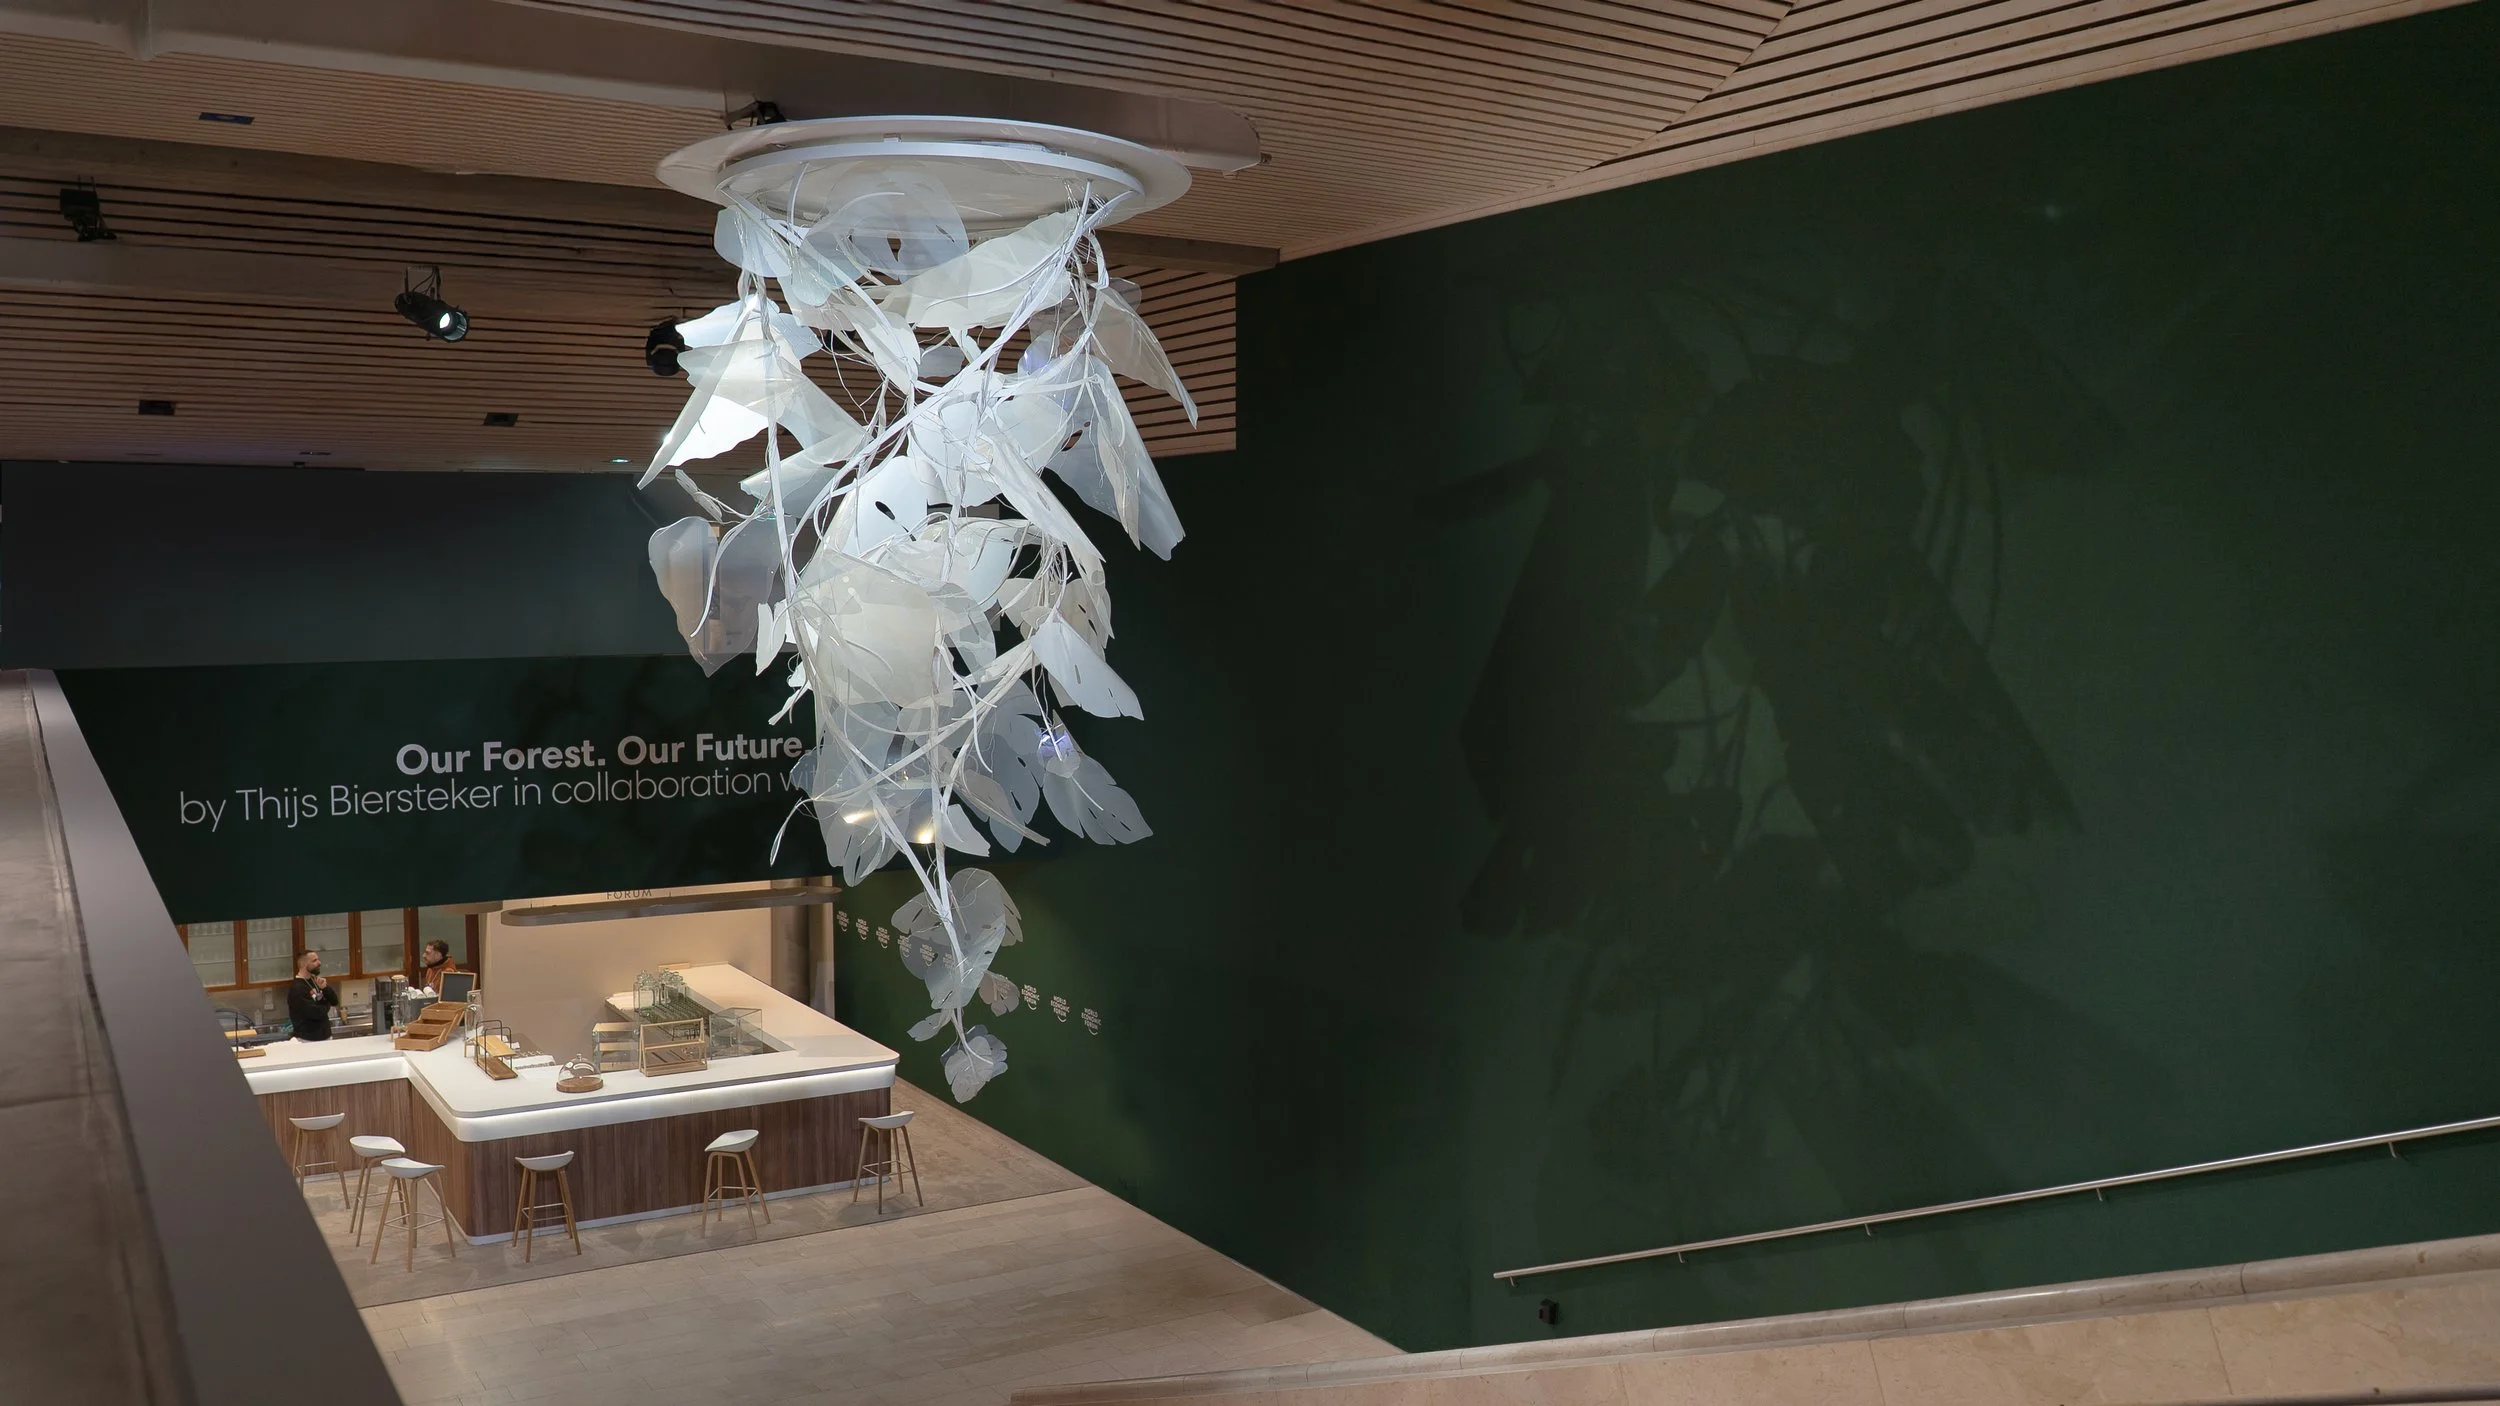
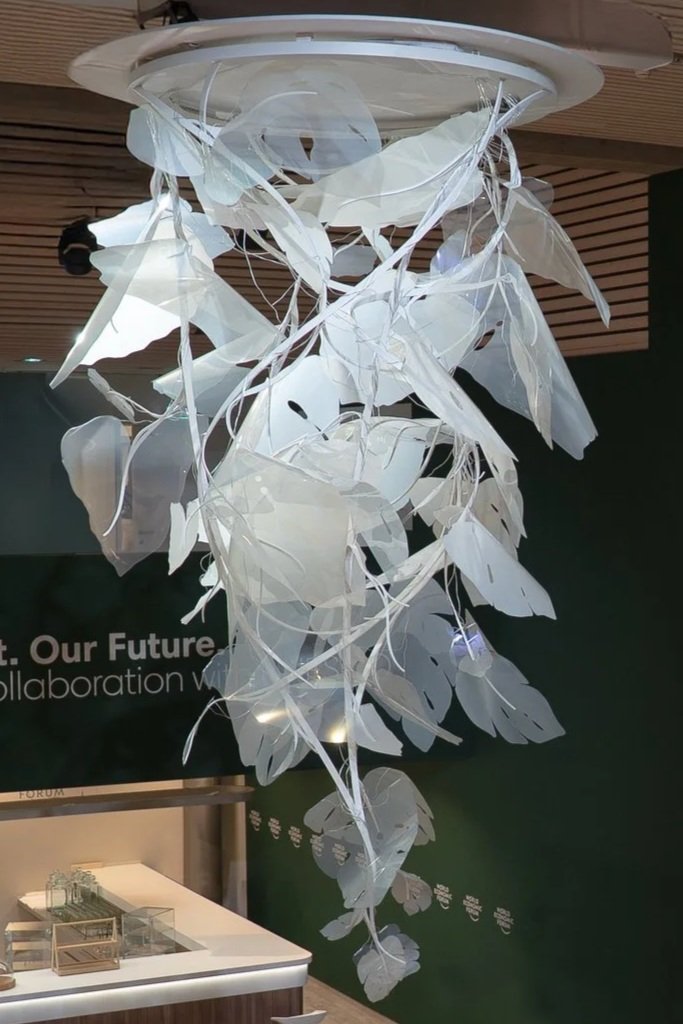
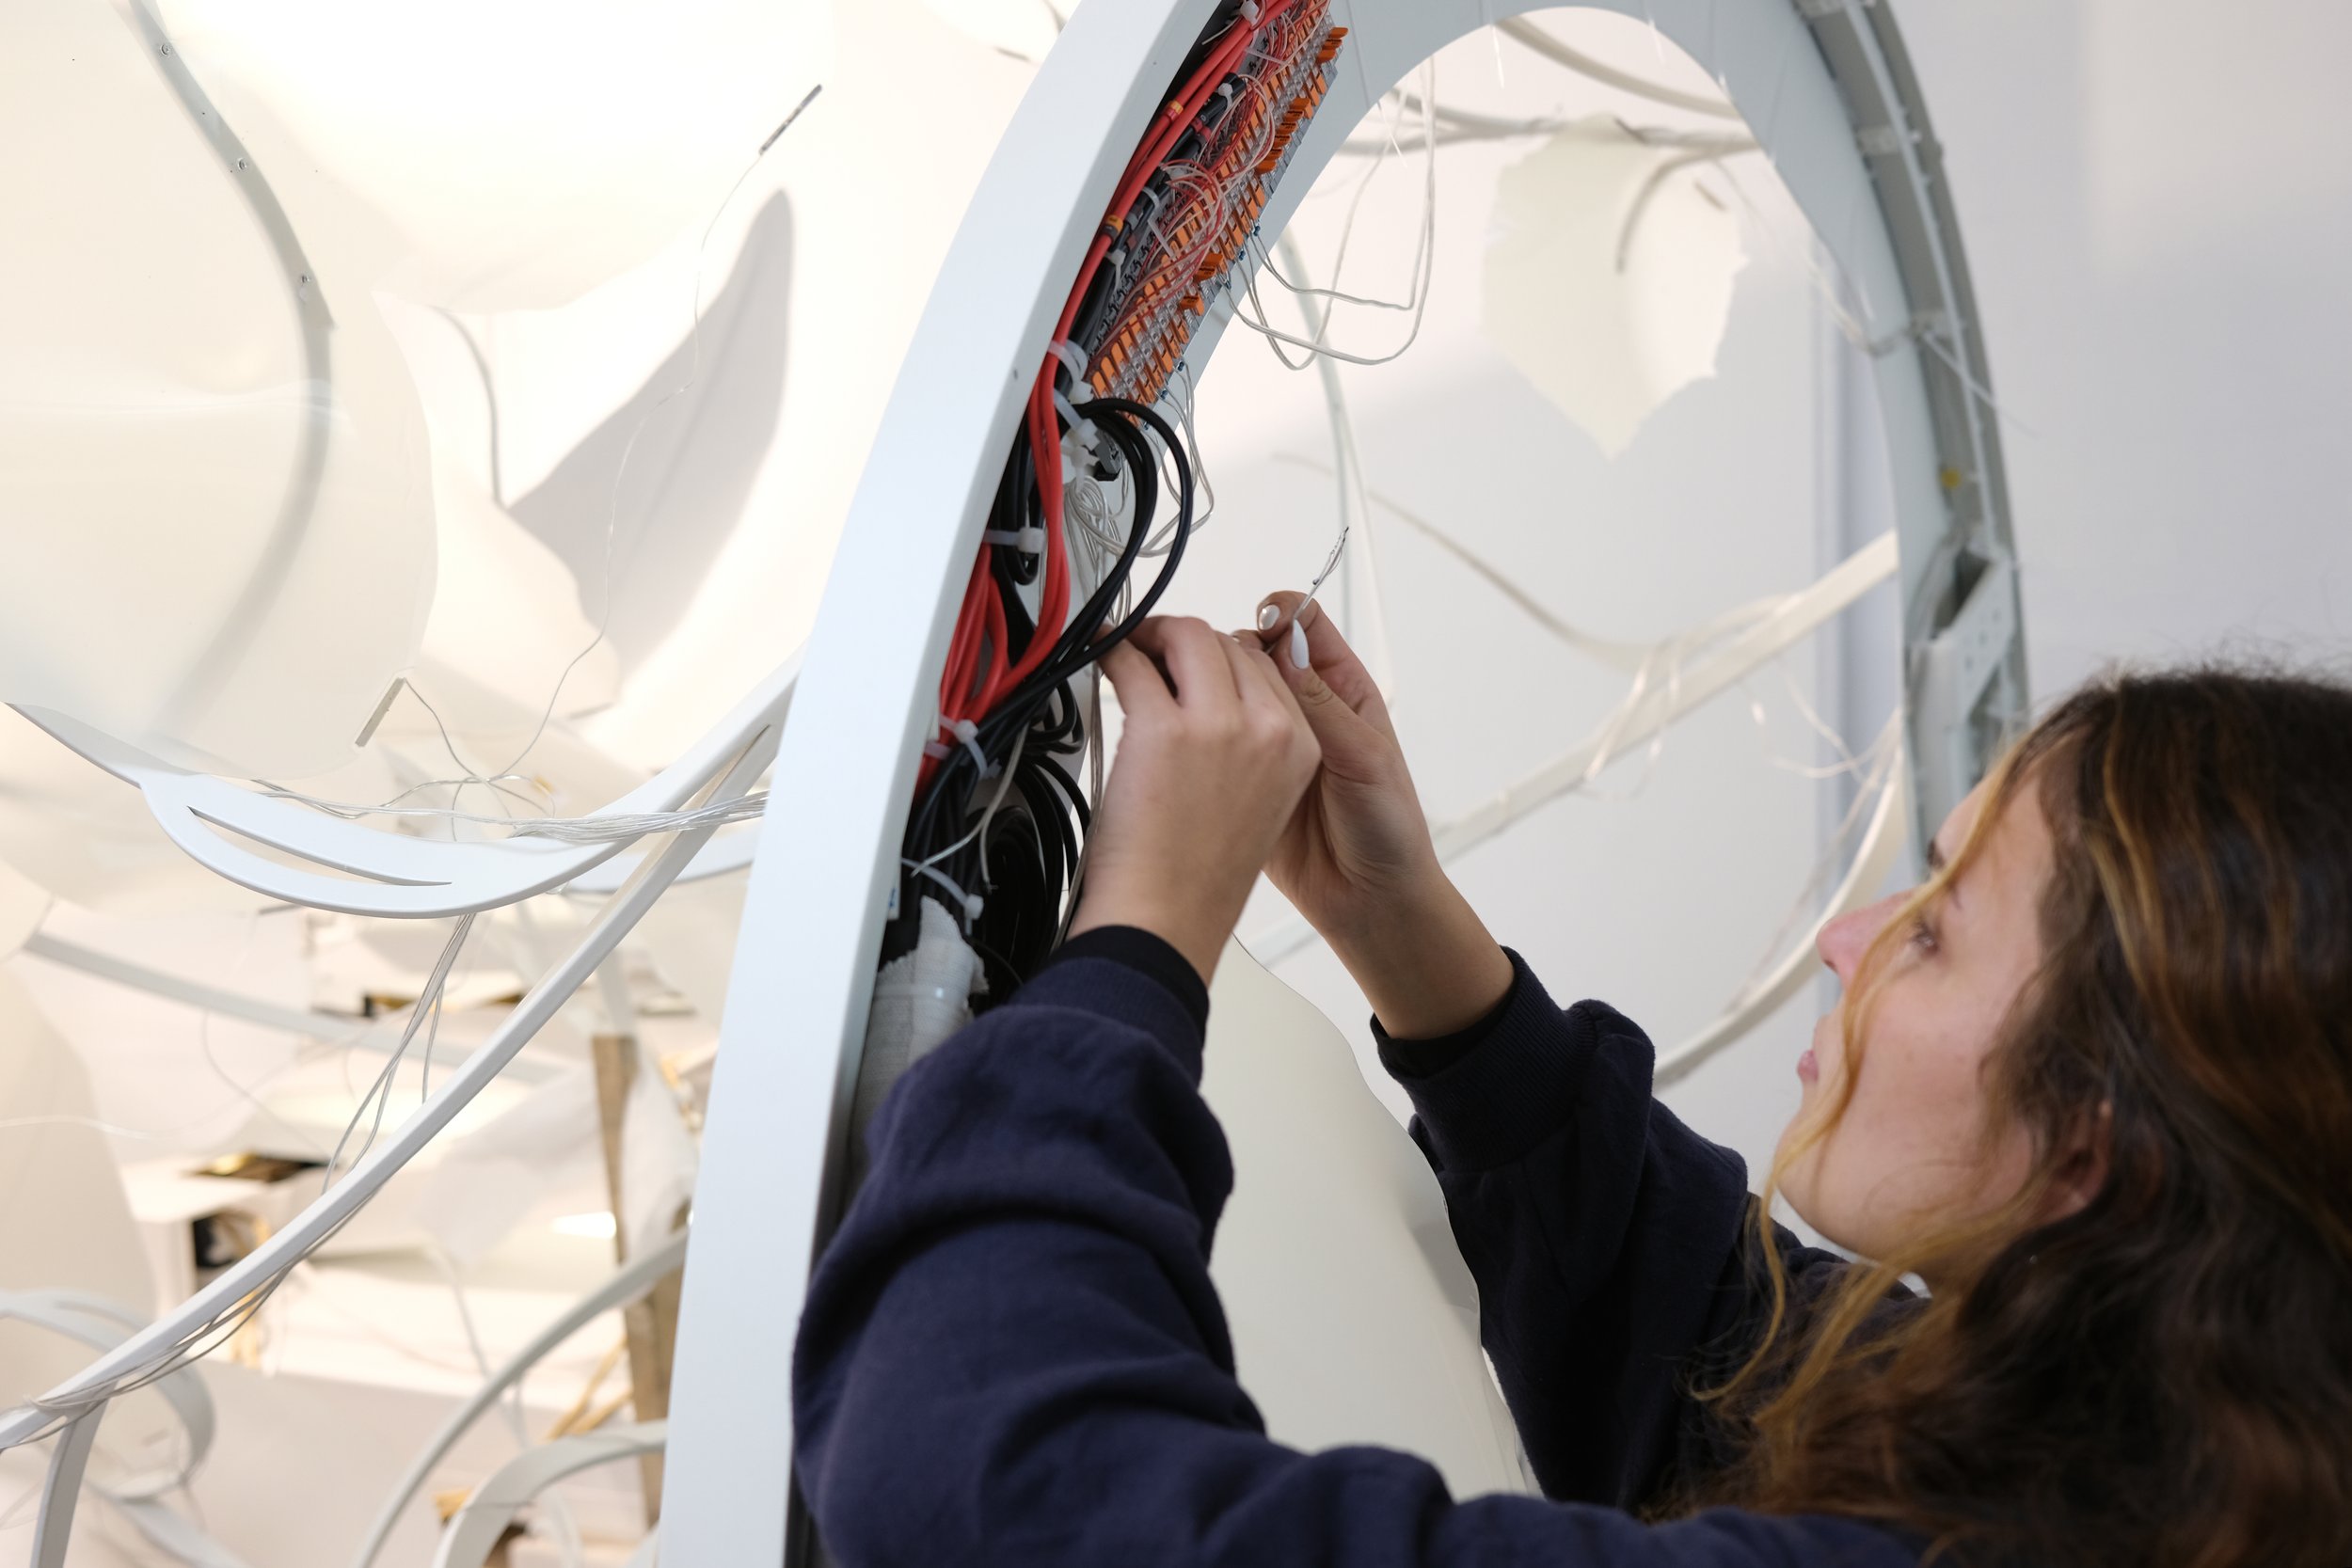
The digital forest sculpture visualises the disappearance and reappearance of forests on our planet through the disappearing and reappearing of leaves in the work.

Each leaf becoming transparent represents 100 m² of forest being lost in real time, while each leaf reappearing represents 100 m² of forest being gained.

Forestate
Forestate is a real-time, data-driven artwork that translates the state of the world’s forests into a tangible, physical experience.

Forestate shows the real-time state of the world’s forests. The title combines “forest” and “state” to signal that the work visualises the measured data of forests’ conditions as they are right now.
Through appearing and disappearing leaves, the artwork brings alive the data of deforestation, regeneration and recovery. Providing a sense of loss and hope at the same time.
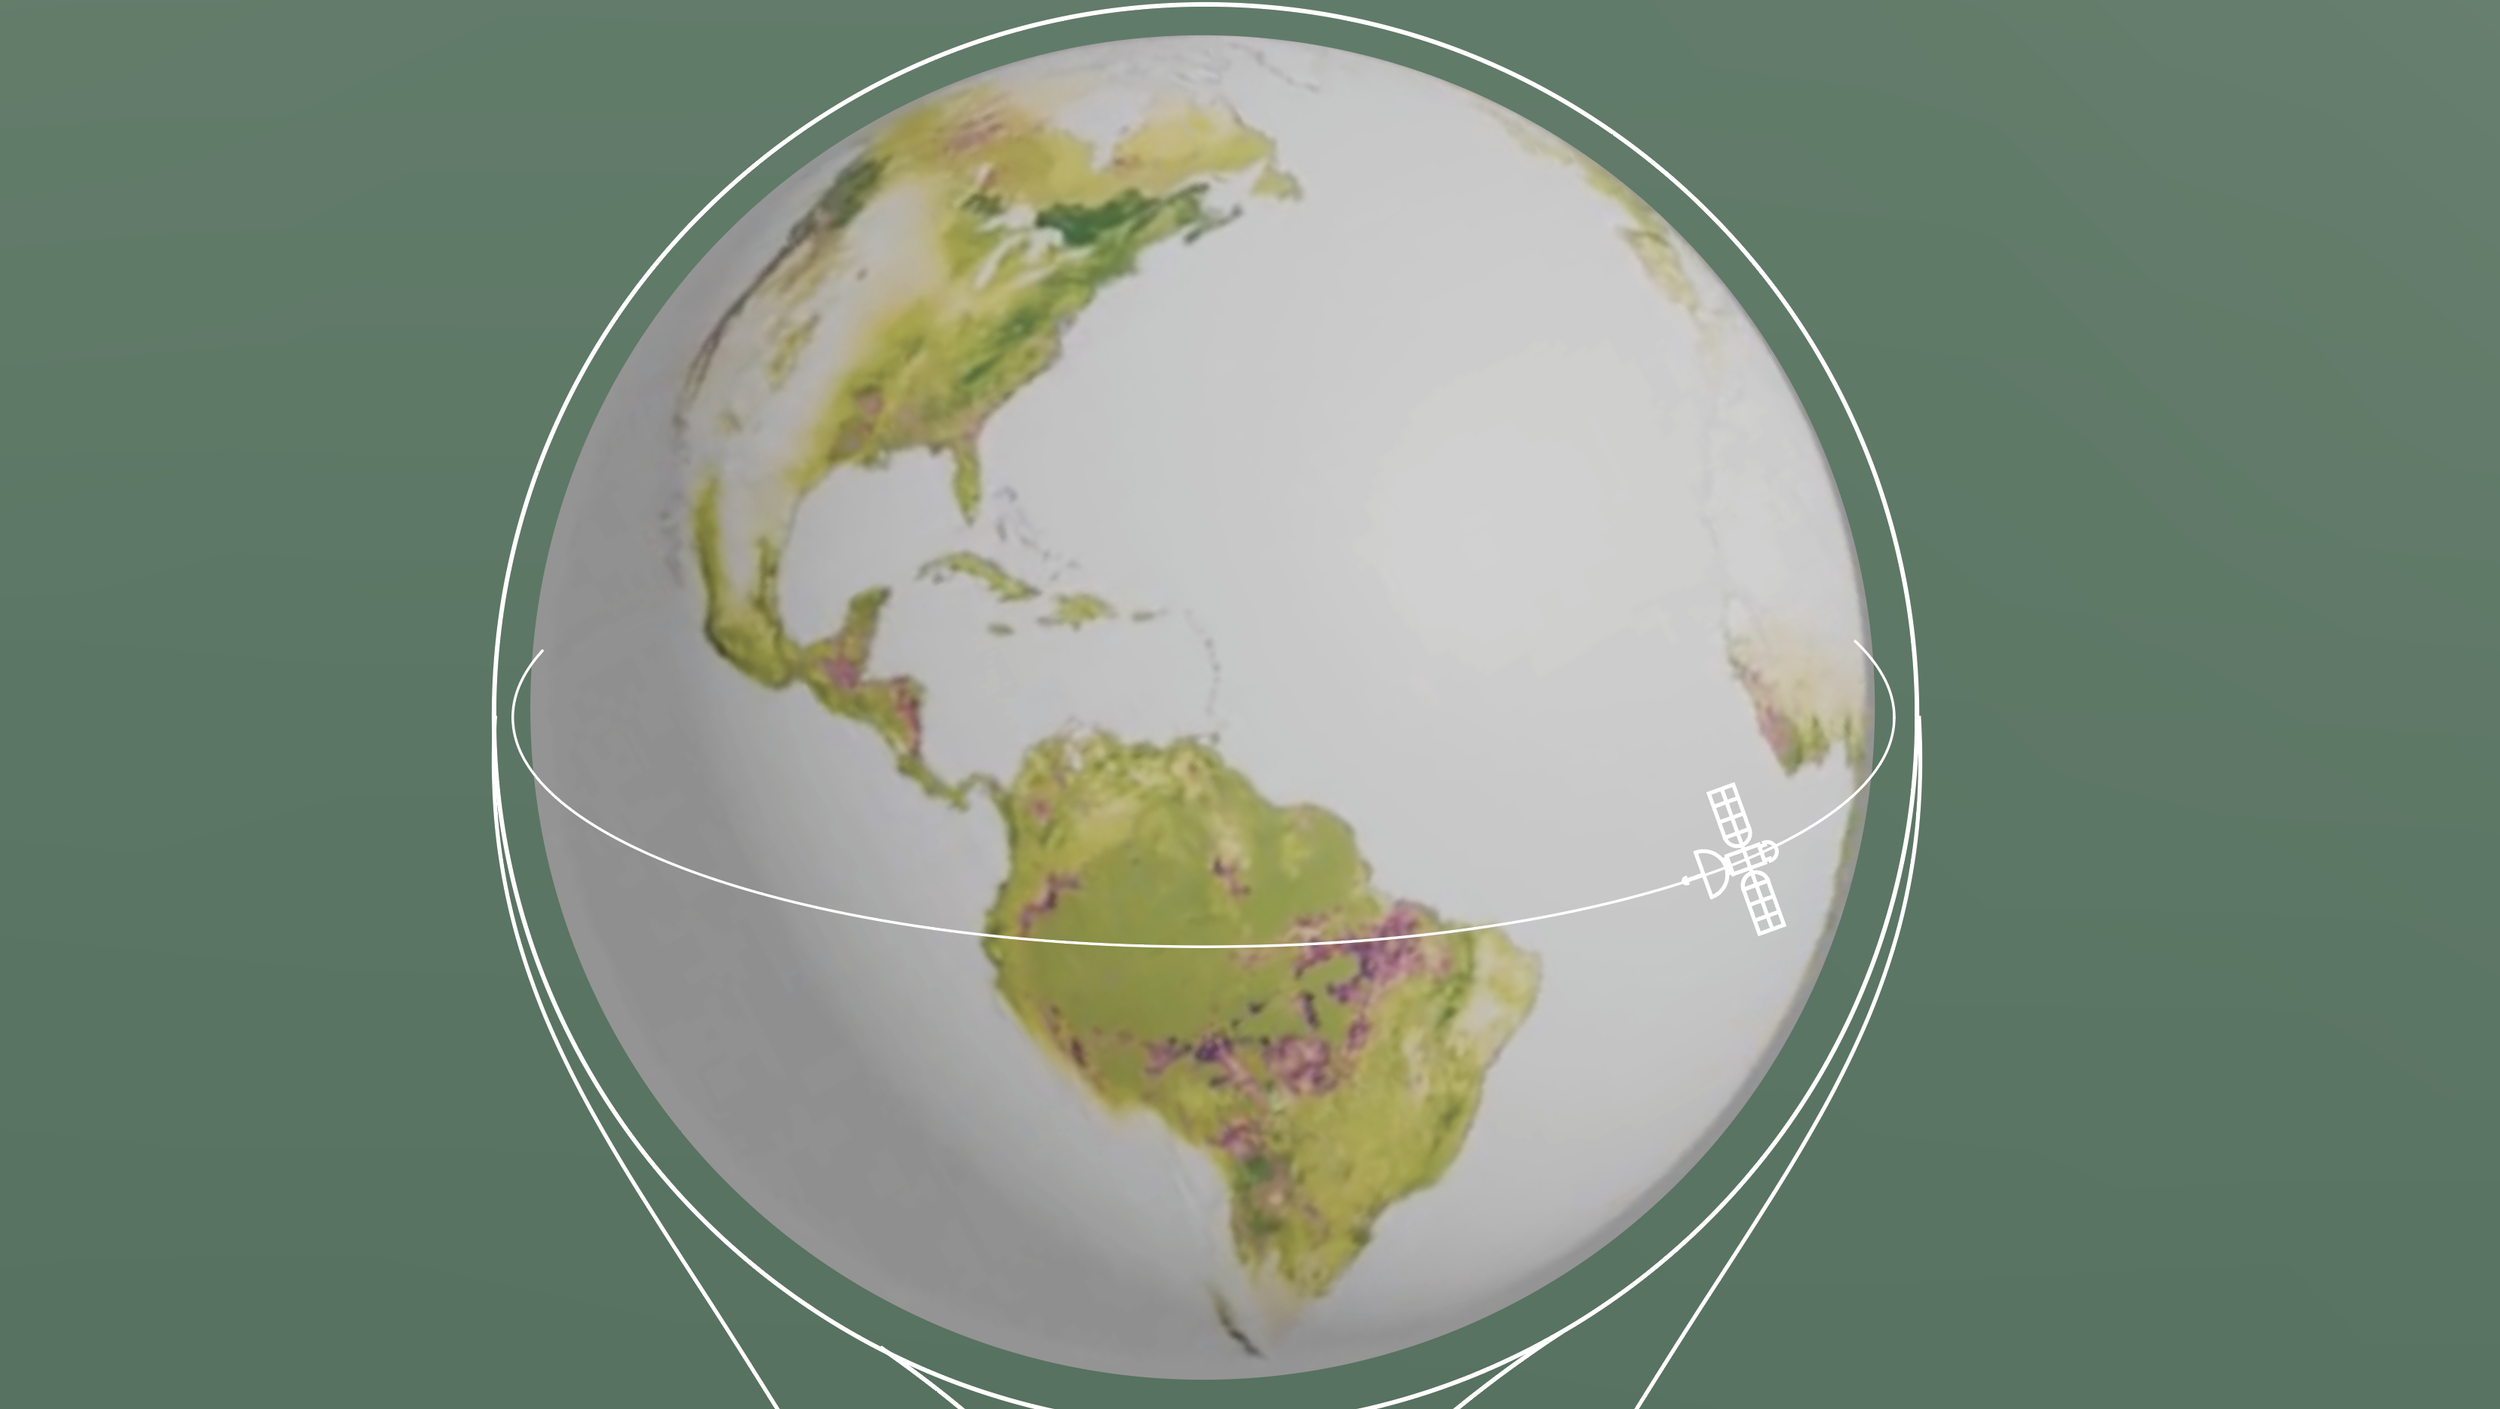
The leaves in the artwork respond continuously to live satellite data from Global Forest Watch datasets that are validated by the series partner UNESCO. Visualising forest loss and recovery happening at this moment. What is normally abstract, distant, and statistical becomes immediate and unavoidable.
Weekly GLAD alerts detect new forest disturbances as they occur. Because forests regenerate over decades rather than days, regrowth is visualised using the scientifically accepted twenty-year average rate of tree cover gain, based on the standard thirty percent canopy threshold used in satellite analysis.
By turning live environmental data into a physical presence, Forestate makes forest loss and recovery perceptible at human scale. Not as an image of nature, but as a measured, ongoing process that is still unfolding.
This creates a constant imbalance in the work. Loss moves fast. Recovery moves slowly. The gap between the two is not symbolic. It is measured, calculated, and visible.
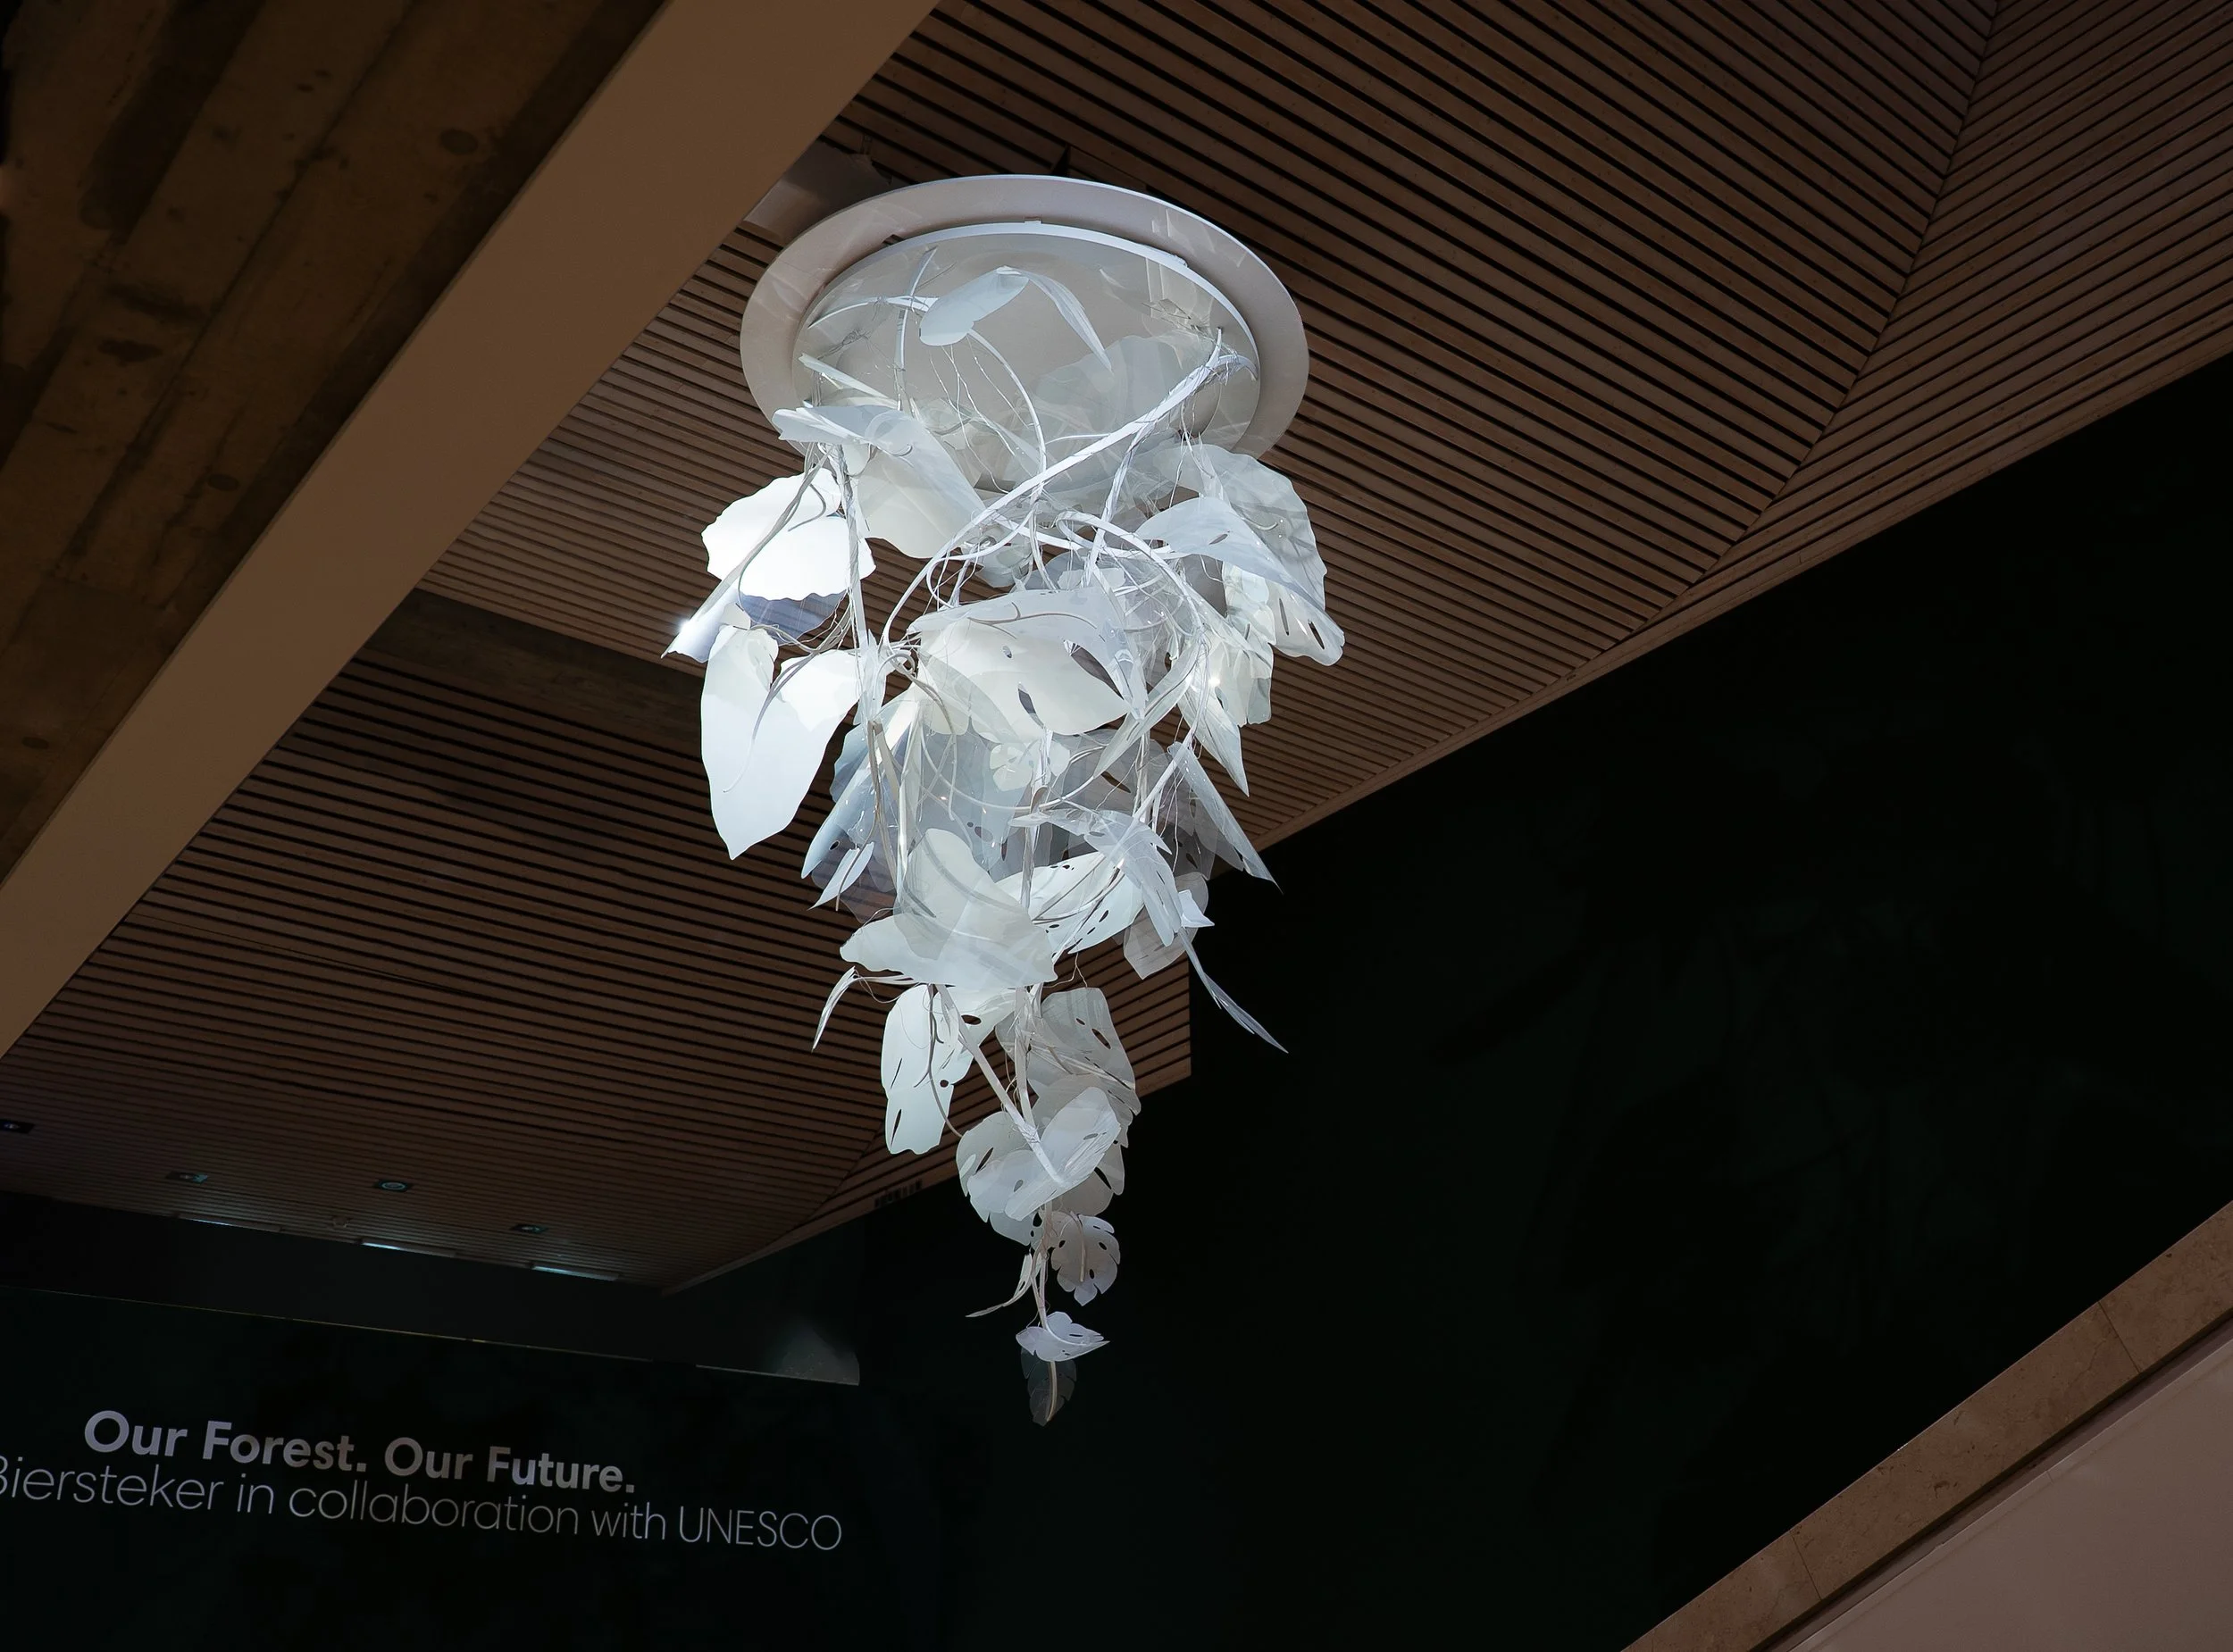
Forestate was commissioned by the
World Economic Forum’s Arts and Culture programme, and developed in collaboration with UNESCO. The artwork is deliberately placed at the centre of one of the world’s most data-driven decision-making environments.

Every leaf disappearing is 100 square meters of forest lost at this moment.
Every leaf reappearing is 100 square meters of forest gained.
Surrounded by reports, dashboards, and projections, the artwork functions as a shared reference point. A reminder of the scale, speed, and consequences of choices being discussed inside the Forum.
Rather than illustrating a future scenario, Forestate shows the present. It does not speculate. It reflects what is happening now, using the same datasets relied upon by scientists, institutions, and policymakers.
Commissioned by
World Economic Forum
Curator
Joseph Fowler
Data partner
UNESCO
Artist
Thijs Biersteker
Sustainably produced at
Woven Studio
Communication and education
Woven Foundation
Studio Director
Sophie de Krom
Software and Data processing
Denisa Půbalová, Thijs Biersteker
Lead Technician
Tomáš Potůček
Construction
Daan van der Sman, Tom Bekkers, Lara Rodrigues Ris, Marie Colombeen,
Yoana Elazarova, Theo Rekelhof
Notable Collaborators
Meriem Bouamrane, Paulo Massoca, Marjolein van Zanten

©WEF_CMcCrickard

Estimating Global Tree Cover Gain and Loss Using Satellite-Derived Forest Change Data
Sources
Global Forest Review (Forest Gain):
https://gfr.wri.org/forest-extent-indicators/forest-gain
GFW Gain and Net Change Update:
https://www.globalforestwatch.org/blog/data-and-tools/new-gfw-tree-cover-gain-net-change-data/
WRI Insight on Tree Cover Gain:
https://www.wri.org/insights/tracking-global-tree-cover-gain
GFW Dashboard:
https://www.globalforestwatch.org/dashboards/global/
Global Forest Review (Forest Loss):
https://gfr.wri.org/forest-extent-indicators/forest-loss
FAO State of the Worlds Forests:
https://www.fao.org/state-of-forests/en/
Our World in Data (Deforestation):
https://ourworldindata.org/deforestation
Forest Declaration Assessment 2022:
https://forestdeclaration.org/wp-content/uploads/2022/10/2022ForestDeclarationAssessment.pdf
Global Forest Change (Hansen et al.):
https://glad.earthengine.app/view/global-forest-change
GLAD Alerts:
https://www.globalforestwatch.org/blog/data-and-tools/glad-deforestation-alerts/
Nature Commentary on GLAD Alerts:
https://www.nature.com/articles/s41559-021-01611-z
The data
Forestate transforms live environmental data into a real-time portrait of the world’s forests. Using UNESCO validated Global Forest Watch data, the work turns complex satellite measurements into a visible choreography of leaves appearing and fading. Each disappearing leaf marks an amount of square meters of forest loss right now, while each returning leaf reflects the long-term average rate of forest regrowth, since real-time measurement of recovery is not possible.
By placing rapid loss alongside slow return, Forestate reveals the imbalance shaping our planet’s forests and offers a quiet reminder that restoring this balance is essential for a nature-positive future.
Calculation Abstract
This calculation establishes a consistent method for estimating global tree cover gain and loss using publicly available satellite datasets from Global Forest Watch and the University of Maryland Global Forest Change products.
Tree cover loss and gain represent two different measurement systems. Loss is updated annually and supported by near-real-time GLAD alerts, making it suitable for near-real-time indicators of current disturbance. Gain is only available as a cumulative 20 year dataset and does not provide annual or near real time values. The gain layer captures the establishment of tree cover in areas without tree cover in 2000 but does not distinguish natural forest regrowth from plantations, assisted restoration, or post harvest recovery. For ecological interpretation, plantation areas must be masked and gain must be restricted to natural forest domains.
Forest estimates are sensitive to the canopy threshold used to define forest. Typical thresholds are 10 percent, 30 percent, and 50 percent canopy cover. Because global indicators often adopt the 30 percent threshold to align with FAO definitions, this analysis uses it as the central case and applies a plus or minus twenty percent sensitivity band to approximate 10 percent and 50 percent thresholds.
Using the Global Forest Review value of 130.9 million hectares of tree cover gain from 2000 to 2020, the cumulative gain converts to 1.309 x 10^12 square meters. Dividing by the 20-year period yields an annual average of 6.545 x 10^10 square meters per year. Converted to a per-second rate, this equals approximately 2080 square meters per second for the 30 percent canopy threshold. Applying the sensitivity range produces gain estimates of roughly 2490 square meters per second at 10 percent canopy and 1660 square meters per second at 50 percent canopy.
Global deforestation reported by FAO for 2015 to 2020 averages 10 million hectares per year, which is equivalent to 1.0 x 10^11 square meters per year or approximately 3170 square meters per second. This represents deforestation specifically and is lower than total tree cover loss reported by Global Forest Watch, but provides a stable, policy-relevant reference value.
Across all canopy thresholds, the estimated loss rate exceeds the gain rate. This result reflects both the faster detectability of forest loss compared with forest gain in satellite data and the underlying imbalance between global deforestation and long term forest regrowth.

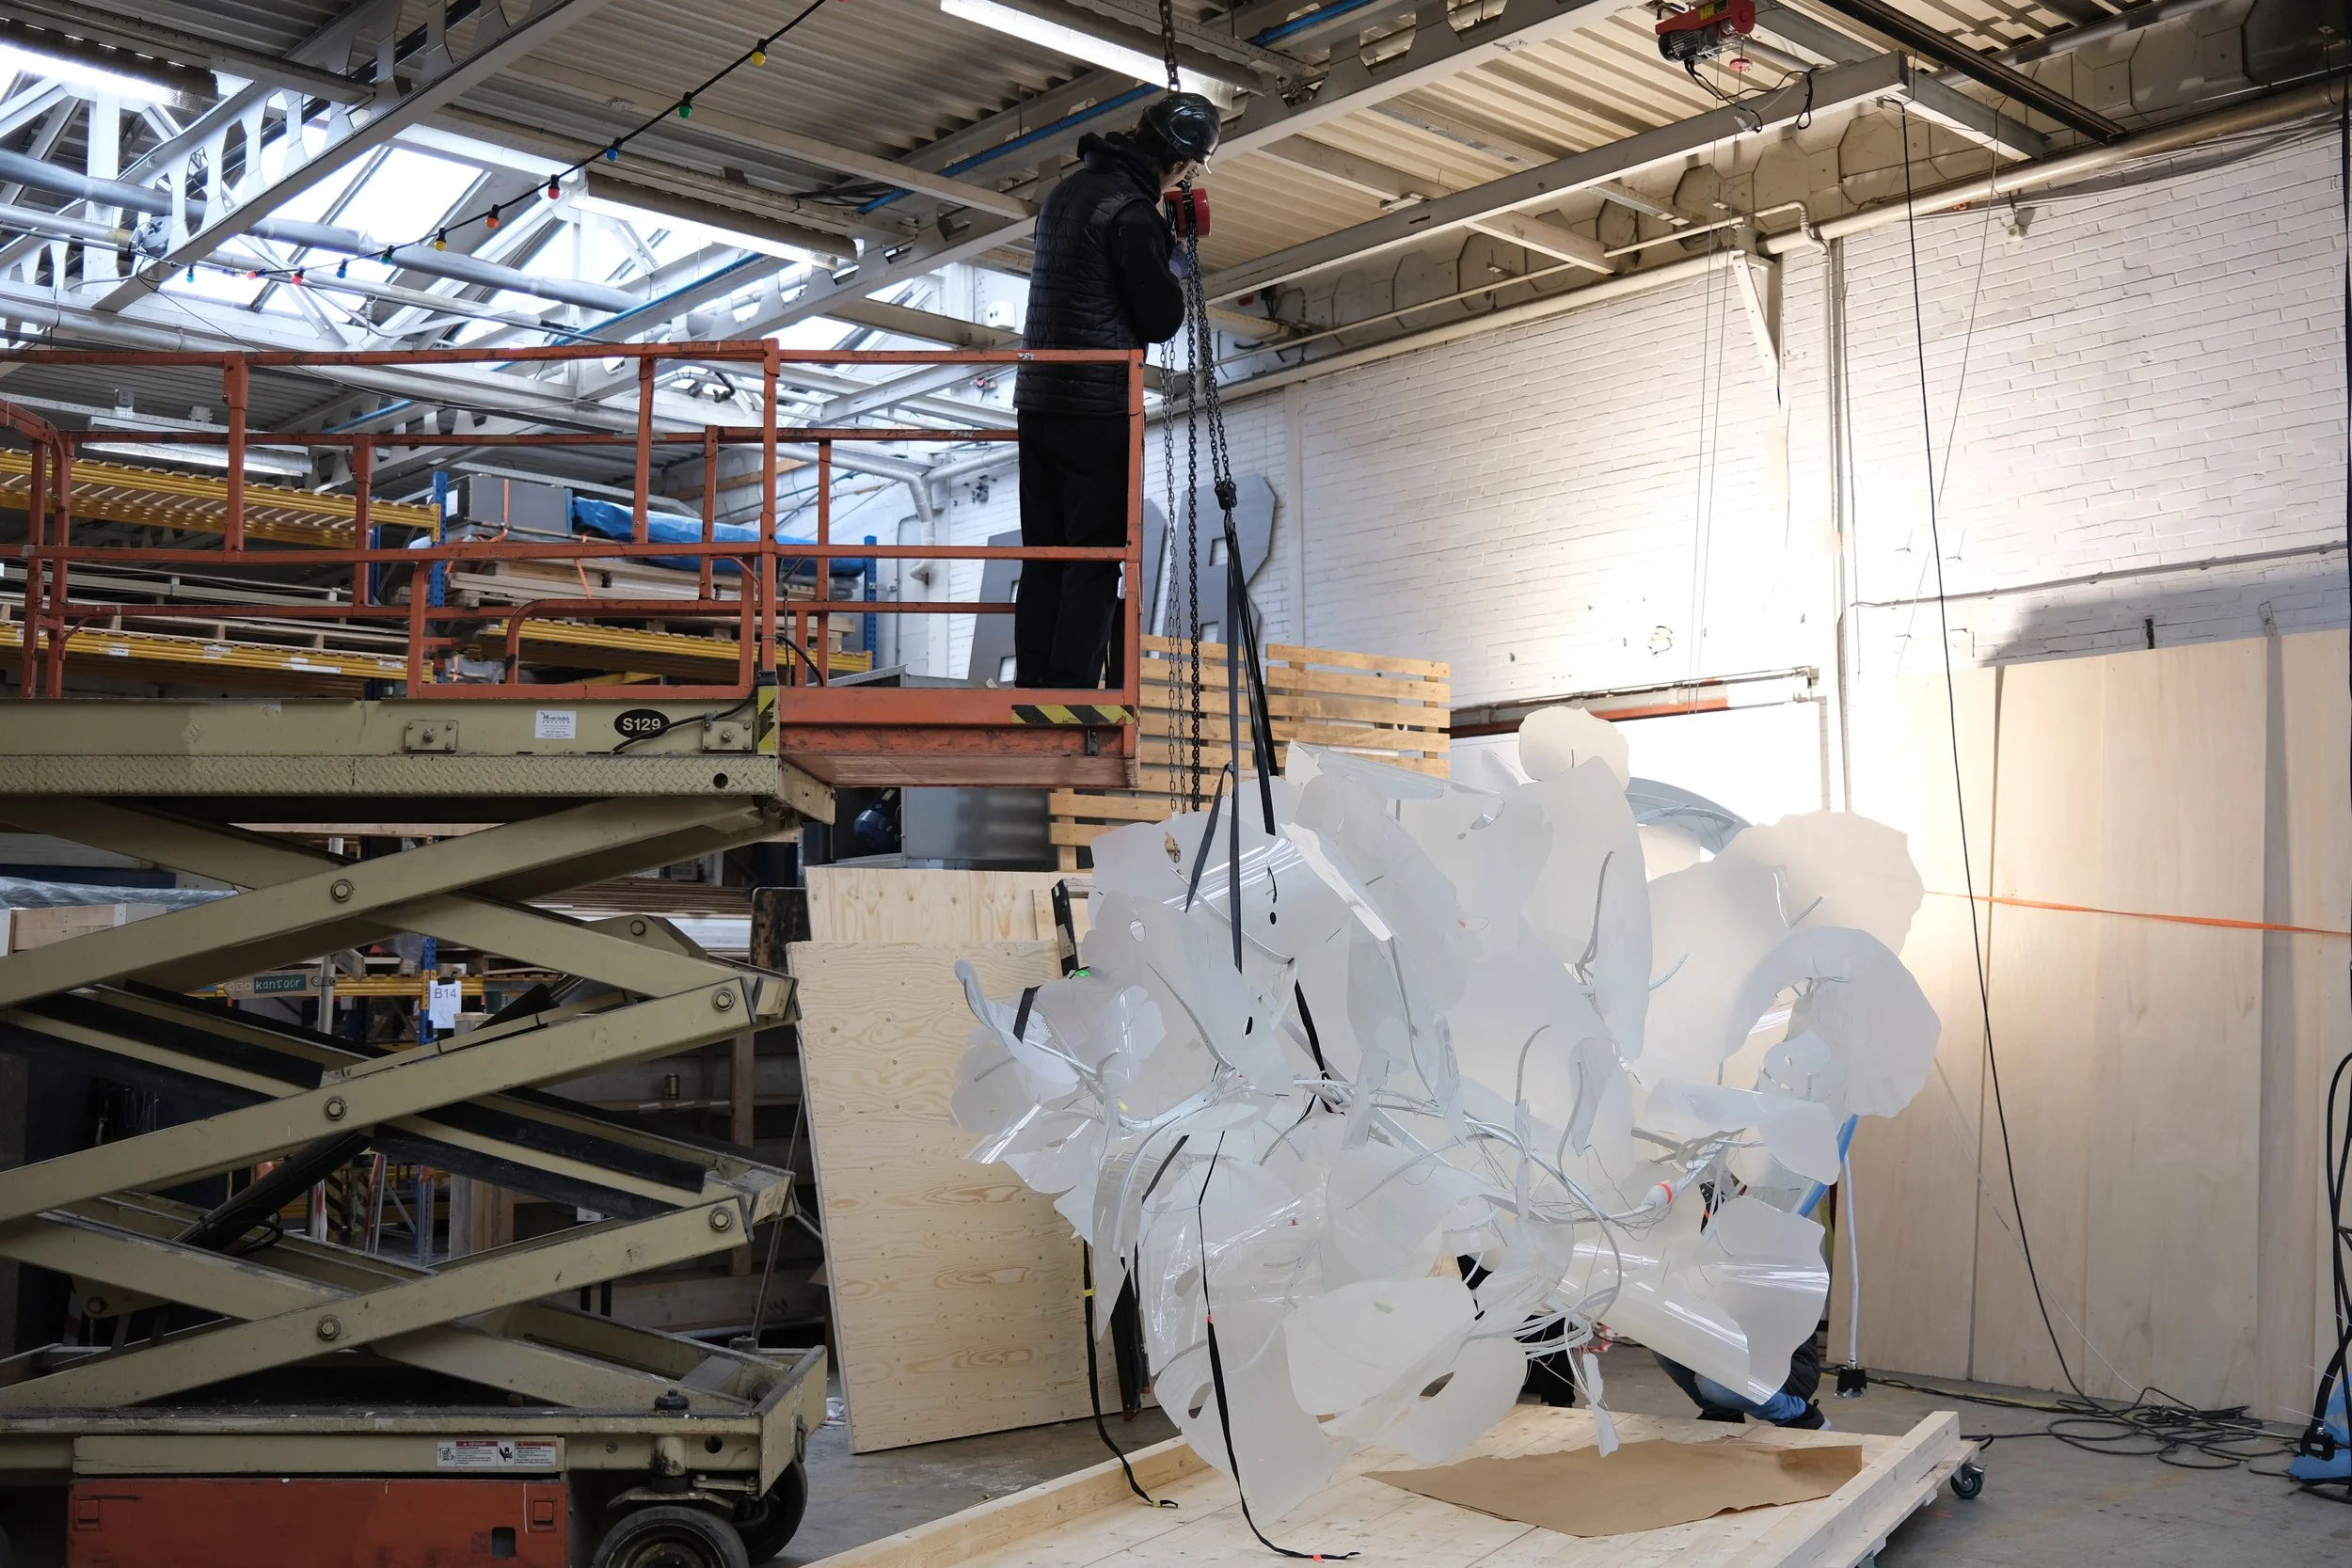
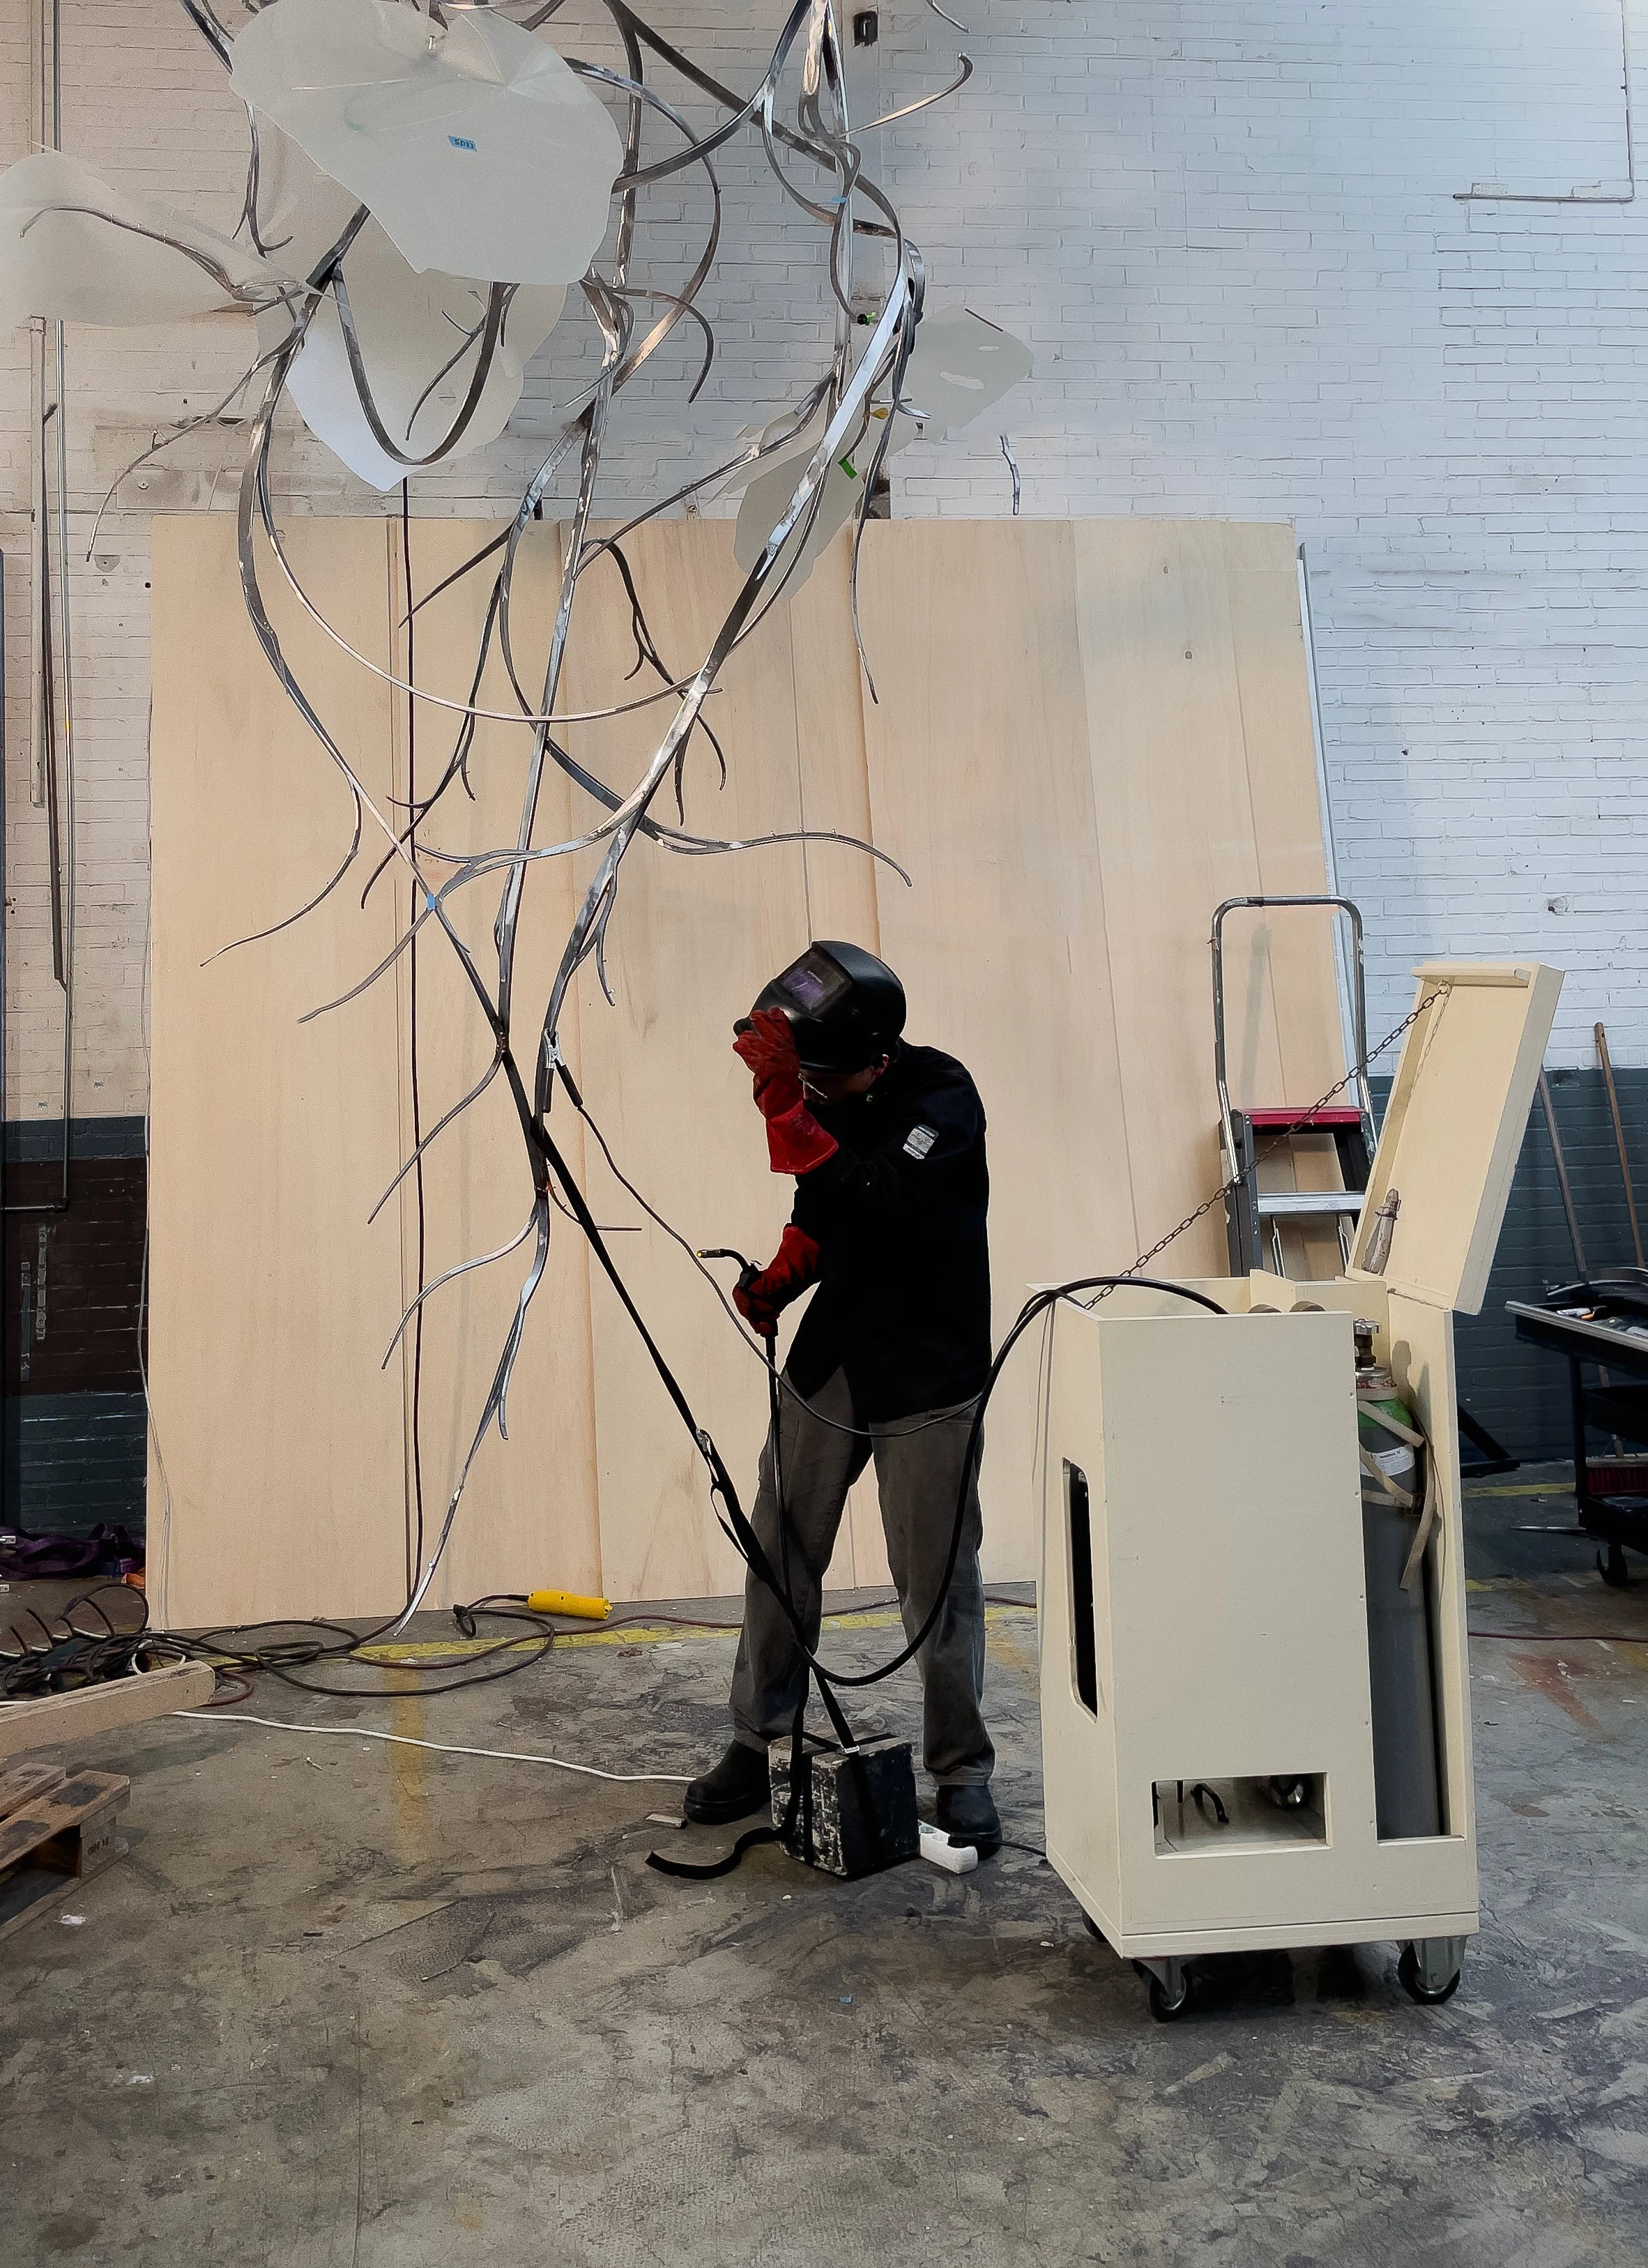
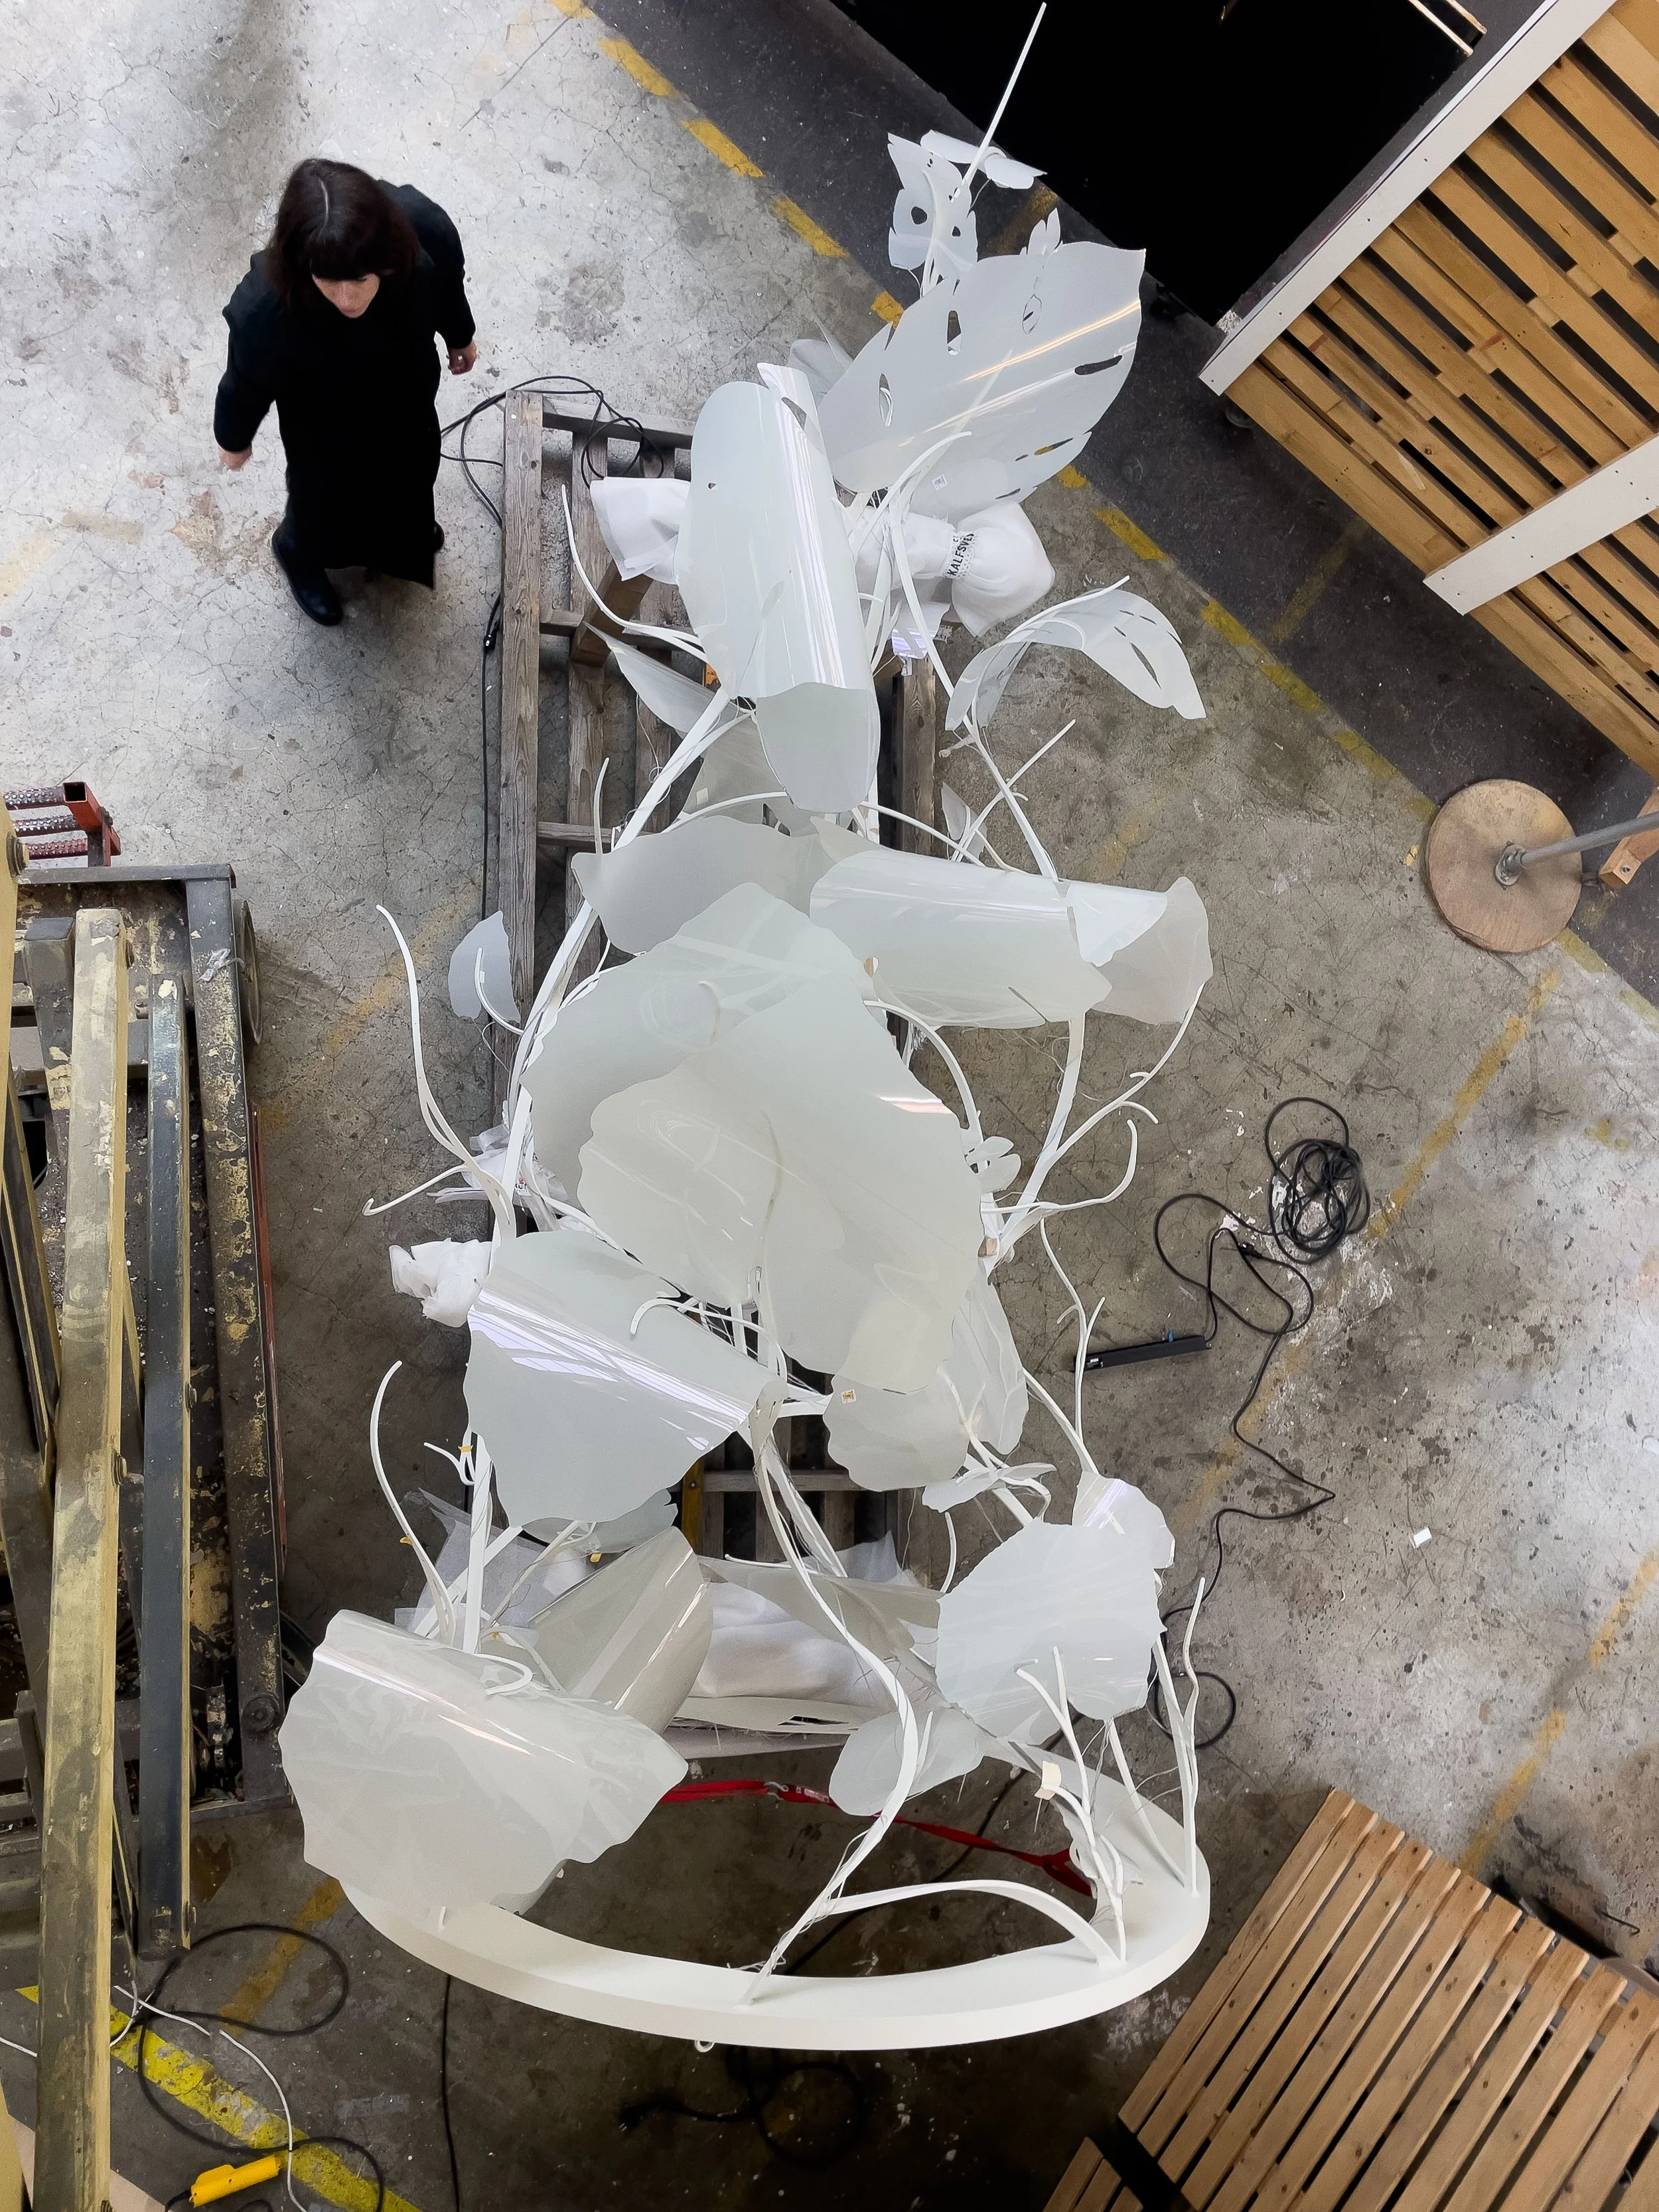
Development of Forestate at Woven Studio